


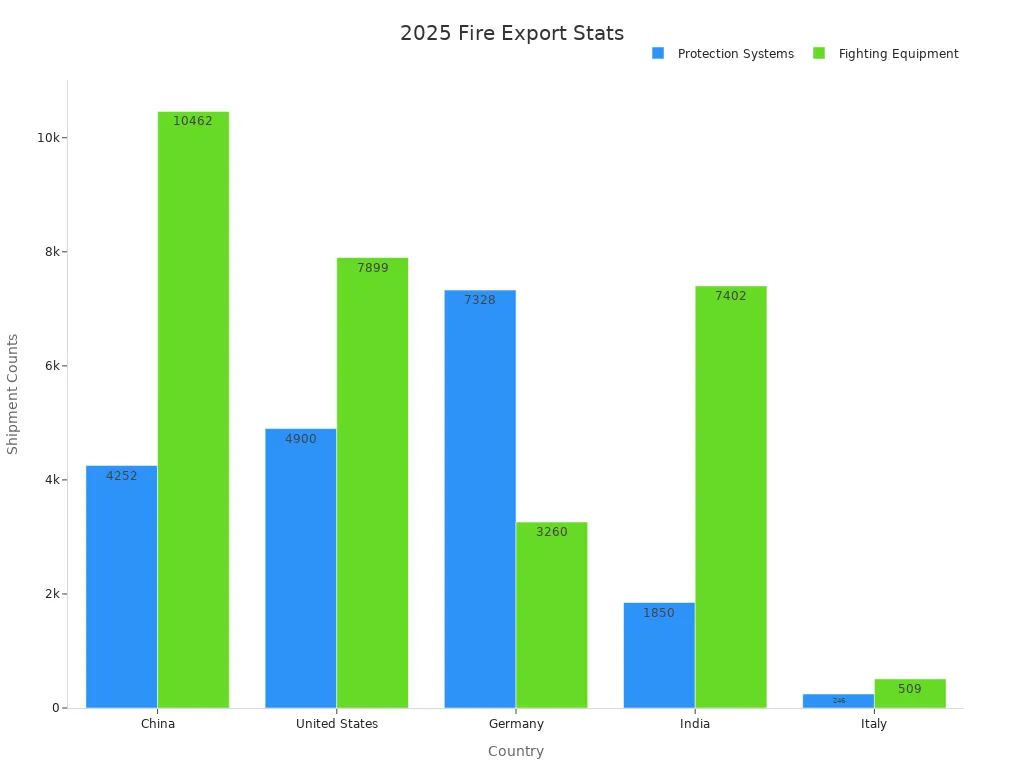
In 2025, China, the United States, Germany, India, and Italy stand out as the top exporters of fire hydrant products. Their leadership reflects strong manufacturing, advanced technology, and established trade connections. The shipment numbers below highlight their dominance in fire hydrant, fire hose, fire hydrant valve, and fire hose reel exports.
| Country | Fire Protection Systems Shipments (2025) | Fire Fighting Equipment Shipments (2025) |
|---|---|---|
| Germany | 7,328 | 3,260 |
| United States | 4,900 | 7,899 |
| China | 4,252 | 10,462 |
| India | 1,850 | 7,402 |
| Italy | 246 | 509 |
Key Takeaways
- China, the United States, Germany, India, and Italy lead the global fire hydrant export market in 2025 due to strong manufacturing, advanced technology, and effective trade policies.
- Rapid urbanization, infrastructure projects, and stricter fire safety regulations drive steady growth and demand for smart, durable fire hydrants worldwide.
- Manufacturers focus on innovation like IoT-enabled smart hydrants and sustainable materials to meet evolving safety standards and expand into emerging markets.
Fire Hydrant Export Market in 2025
Fire Hydrant Export Volumes and Market Share
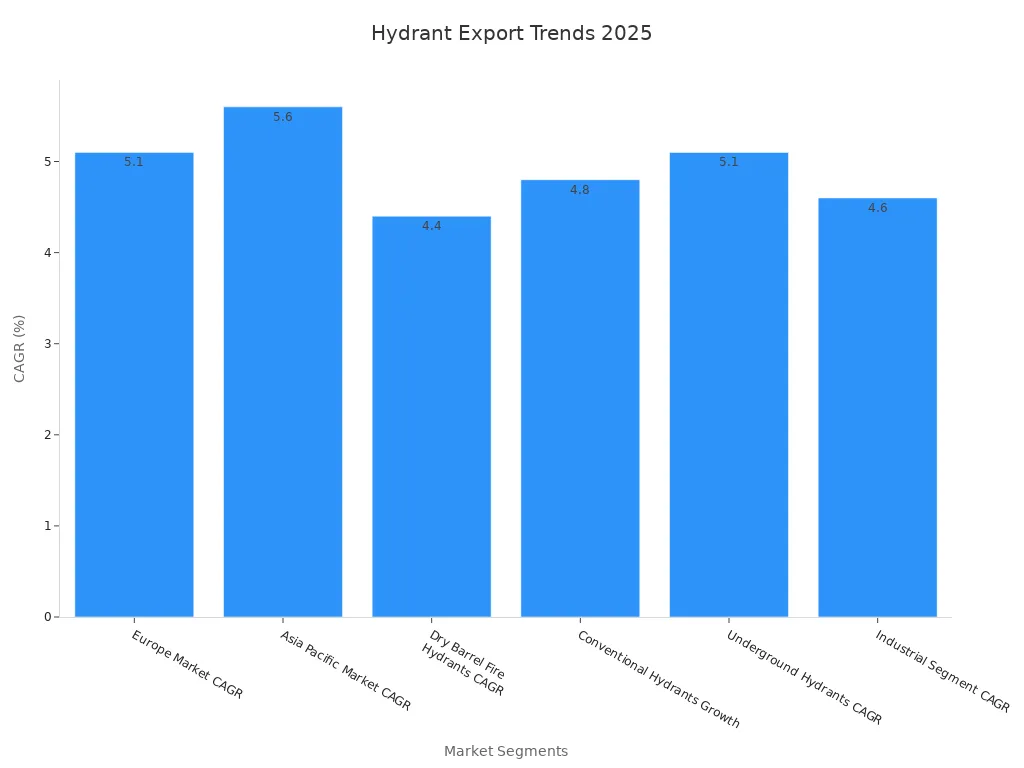
The global fire hydrant export market shows strong growth in 2025. Asia Pacific leads with the fastest growth rate, driven by rapid industrialization and a rising population. Europe follows as the second-largest market, supported by high construction spending and strict fire safety codes. The industrial segment holds the largest share, with fire hydrants widely used in mining, manufacturing, and chemical industries.
| Segment / Region | Growth Rate / Key Trend |
|---|---|
| Europe Market CAGR | 5.1% (second-largest market, driven by construction spending and strict fire safety codes) |
| Asia Pacific Market CAGR | 5.6% (fastest-growing, driven by industrialization and population growth) |
| LAMEA Market Drivers | Infrastructure investments, fire accident rise, government regulations |
| Dry Barrel Fire Hydrants CAGR | 4.4% (widely used in frost-prone areas, especially US) |
| Conventional Hydrants Growth | 4.8% (majority share, widely used in fire protection) |
| Underground Hydrants CAGR | 5.1% (dominant due to cost-effectiveness and safety) |
| Industrial Segment CAGR | 4.6% (largest share, used in mining, manufacturing, oil & gas, chemical industries) |
| Key Market Drivers | Urbanization, industrialization, regulatory norms, demand for durable hydrants |
Key Trends in Fire Hydrant Exports
Several trends shape the fire hydrant export market in 2025. Manufacturers invest in smart hydrants with IoT technology, which helps cities monitor water flow and predict maintenance needs. Many companies use sustainable materials, such as stainless steel and corrosion-resistant plastics, to meet environmental goals. Strict fire safety regulations and growing urban populations increase demand for reliable fire protection systems. North America and Europe lead in regulatory compliance, while Asia Pacific experiences rapid growth due to urbanization and new infrastructure projects.
Note: The market size is expected to reach USD 2,070.22 million by 2028, with a global CAGR of 4.6%. Major players include American Cast Iron Company and AVK International A/S.
China: Fire Hydrant Export Leader

Fire Hydrant Export Statistics
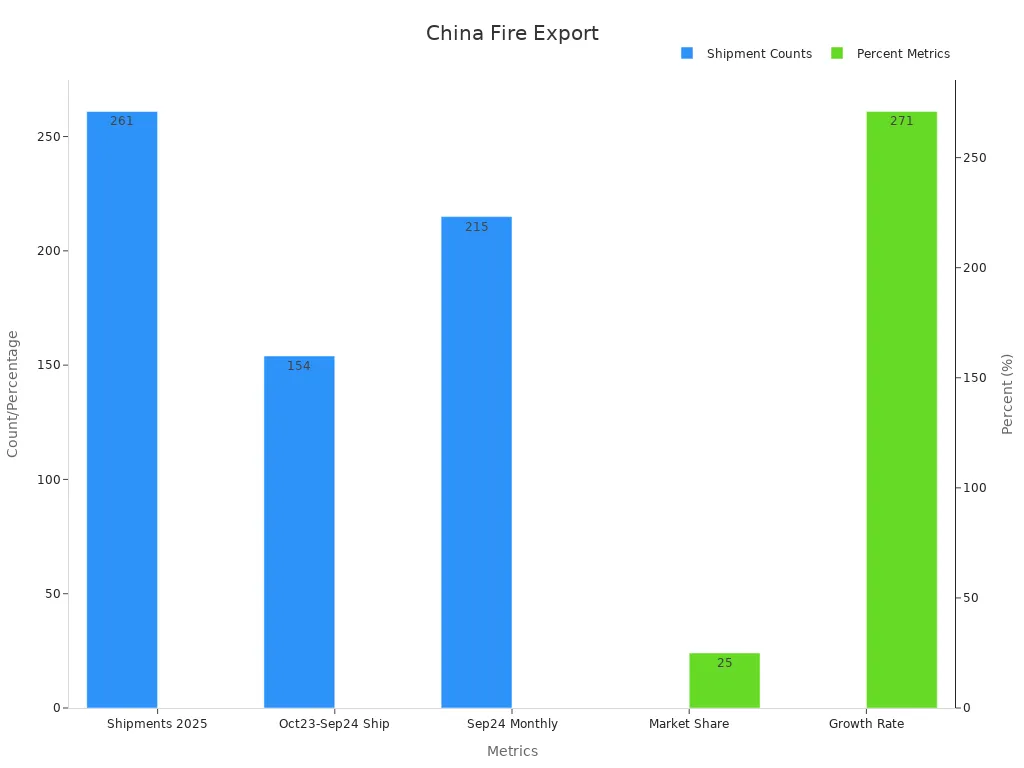
China remains a dominant force in the global fire hydrant export market in 2025. The country shipped 261 units by April 10, 2025, capturing a 25% market share. India leads with 277 shipments and a 27% share, but China shows remarkable growth. From October 2023 to September 2024, China exported 154 shipments, accounting for 37% of global shipments during that period. The monthly export volume reached 215 shipments in September 2024, reflecting a 10650% year-on-year increase and a 13% sequential rise. The following table summarizes these figures:
| Metric | China (2025 Data) | Notes/Period Covered |
|---|---|---|
| Number of Shipments | 261 | Data updated till April 10, 2025 |
| Market Share | 25% | Second largest exporter after India |
| Comparison with India | India: 277 shipments, 27% share | India leads globally |
| Shipment Count (Oct 2023-Sep 2024) | 154 shipments (37% share) | China largest exporter in this period |
| Global Export Shipments (Oct 2023-Sep 2024) | 501 total shipments worldwide | 64 exporters, 158 buyers globally |
| Growth Rate | 271% year-on-year growth | Compared to previous 12 months |
| Monthly Export (Sep 2024) | 215 shipments | 10650% YoY growth, 13% sequential growth |
Manufacturing Capacity and Technology
China’s manufacturing sector continues to advance rapidly. Companies like Center Enamel lead the way with innovative fire water storage tanks that use Glass-Fused-to-Steel (GFS) technology. These tanks are durable, leak-proof, and resistant to corrosion. They meet strict fire safety standards such as NFPA 22. The outdoor fire hydrant system market in China grows quickly due to urbanization and industrialization. Many manufacturers, including Yuyao World Fire Fighting Equipment Factory, invest in smart hydrants with integrated sensors and IoT connectivity. This focus on technology and quality helps China maintain its strong position in the global market.
Trade Policies and Global Reach
China’s trade policies support export growth. The country maintains robust trade networks with over 150 countries. Exporters benefit from streamlined customs procedures and government incentives. Chinese fire hydrant products reach markets in Asia, Europe, Africa, and the Americas. The combination of advanced manufacturing, strong policy support, and global partnerships ensures China’s continued leadership in fire hydrant exports.
United States: Fire Hydrant Innovation and Quality
Fire Hydrant Export Data and Major Destinations
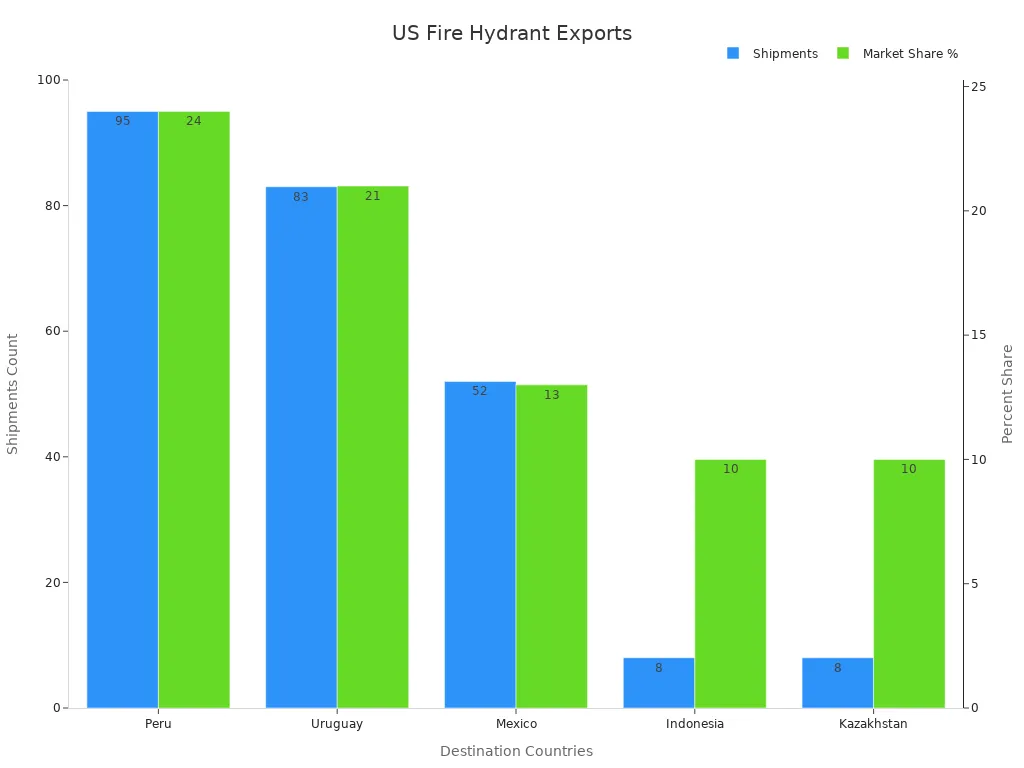
The United States holds a strong position in the global fire hydrant export market. Major importers include Peru, Uruguay, and Mexico, which together account for over half of U.S. hydrant valve exports. The country exports to more than 42 destinations, showing broad international reach. The table below highlights key export destinations and their market shares:
| Destination Country | Shipments | Market Share (%) | Notes |
|---|---|---|---|
| Peru | 95 | 24 | Leading importer, part of 59% total exports to top 3 countries |
| Uruguay | 83 | 21 | Second largest importer, 27% share in recent year shipments |
| Mexico | 52 | 13 | Third largest importer |
| Indonesia | 8 | 10 (recent year) | Among top importers Sep 2023-Aug 2024 |
| Kazakhstan | 8 | 10 (recent year) | Among top importers Sep 2023-Aug 2024 |
Technological Advancements in Fire Hydrant Production
The U.S. leads the industry with advanced fire hydrant technology. Manufacturers use smart sensors, wireless communication, and cloud-based analytics to improve performance. These features allow real-time monitoring of water pressure, flow, and quality. Since 2022, low-power wireless sensors have made deployment more affordable. Strategic partnerships help integrate hydrant data into smart city systems. The U.S. smart monitoring fire hydrant market reached $866 million in 2025 and continues to grow. Major companies invest in freeze-resistant designs and corrosion-resistant materials, ensuring reliability in diverse environments.
Regulatory Standards and Trade Agreements
Strict fire safety regulations drive innovation in the U.S. market. Manufacturers must meet evolving standards, which pushes them to exceed minimum requirements. Major industry players, such as American Flow Control and American Cast Iron Pipe Company, set high benchmarks for quality. The U.S. maintains trade agreements that support exports to key markets. These agreements, combined with robust infrastructure and early adoption of new technologies, reinforce the country’s leadership in fire hydrant systems.
Germany: Fire Hydrant Engineering Excellence
Fire Hydrant Export Performance
Germany stands out as a leader in fire safety equipment exports. The country’s manufacturers ship thousands of units each year. German companies hold the second-highest number of shipments and manufacturers worldwide. This strong performance shows Germany’s commitment to quality and reliability in the global market.
| Metric | Germany’s Performance | Global Rank |
|---|---|---|
| Fire safety equipment shipments | 7,215 shipments | 2nd |
| Number of manufacturers | 480 manufacturers | 2nd |
| Fire safety equipment imports | 343 shipments | 8th |
These numbers highlight Germany’s important role in supplying fire safety solutions to many countries.
Quality Standards and Compliance
German fire hydrants meet some of the strictest safety and quality standards in the world. Several organizations help ensure this high level of compliance:
- TÜV Rheinland tests and inspects fire protection systems. Their work covers risk assessment, planning, safety regulation checks, and regular system testing.
- UL Solutions certifies fire main equipment. They focus on product performance, safety, and reliability.
- Verisk provides risk assessment data. Their grading includes water supply quality and hydrant data, which helps manage fire protection risks.
These steps guarantee that German fire hydrants remain safe, reliable, and effective.
Key Drivers for Fire Hydrant Exports
Several factors drive Germany’s success in fire hydrant exports:
- Advanced engineering and manufacturing processes
- Strong focus on product innovation and durability
- Strict adherence to international safety standards
- Wide network of experienced manufacturers
German companies continue to invest in research and development. This focus helps them deliver high-quality products that meet the needs of global customers.
India: Rapid Growth in Fire Hydrant Exports
Fire Hydrant Export Growth and Emerging Markets
India has seen a remarkable increase in fire hydrant exports over the past two years. Export records show shipments to countries across Asia, Europe, Africa, and North America. The table below highlights recent export activity:
| Date | Destination | Quantity (Units) | Value (USD) |
|---|---|---|---|
| Jun 6, 2024 | France | 162 | $30,758.36 |
| Jun 5, 2024 | Bhutan | 12 | $483.78 |
| Jun 3, 2024 | Indonesia | 38 | $7,112.36 |
| Jun 1, 2024 | Nepal | 55 | $4,151.00 |
| May 30, 2024 | Indonesia | 150 | $18,823.15 |
| Aug 22, 2024 | United States | 720 | $13,367.37 |
| Aug 21, 2024 | United Arab Emirates | 25 | ~$3,250 |
| Aug 23, 2024 | Tanzania | 1118 KGM | $9,763.80 |
Between October 2022 and September 2024, India recorded over 2,000 fire hydrant valve shipments, involving hundreds of buyers and suppliers. This broad reach demonstrates India’s growing influence in emerging markets.
Competitive Manufacturing and Cost Advantages
Indian manufacturers offer several advantages in the global fire hydrant market:
- Efficient production processes lower costs.
- Access to skilled labor supports high output.
- Proximity to raw materials reduces supply chain delays.
- Flexible manufacturing allows quick response to custom orders.
These strengths help Indian companies compete with established exporters and win contracts in new regions.
Government Support for Fire Hydrant Exports
The Indian government provides strong support for fire hydrant exporters. Exporters benefit from trade incentives, simplified customs procedures, and access to advanced export data tools. These measures help companies identify fast-growing markets and expand their global presence.
India’s rapid export growth, competitive manufacturing, and government backing position the country as a key player in the fire hydrant industry.
Italy: Tradition and Innovation in Fire Hydrant Exports
Fire Hydrant Export Data and Market Share
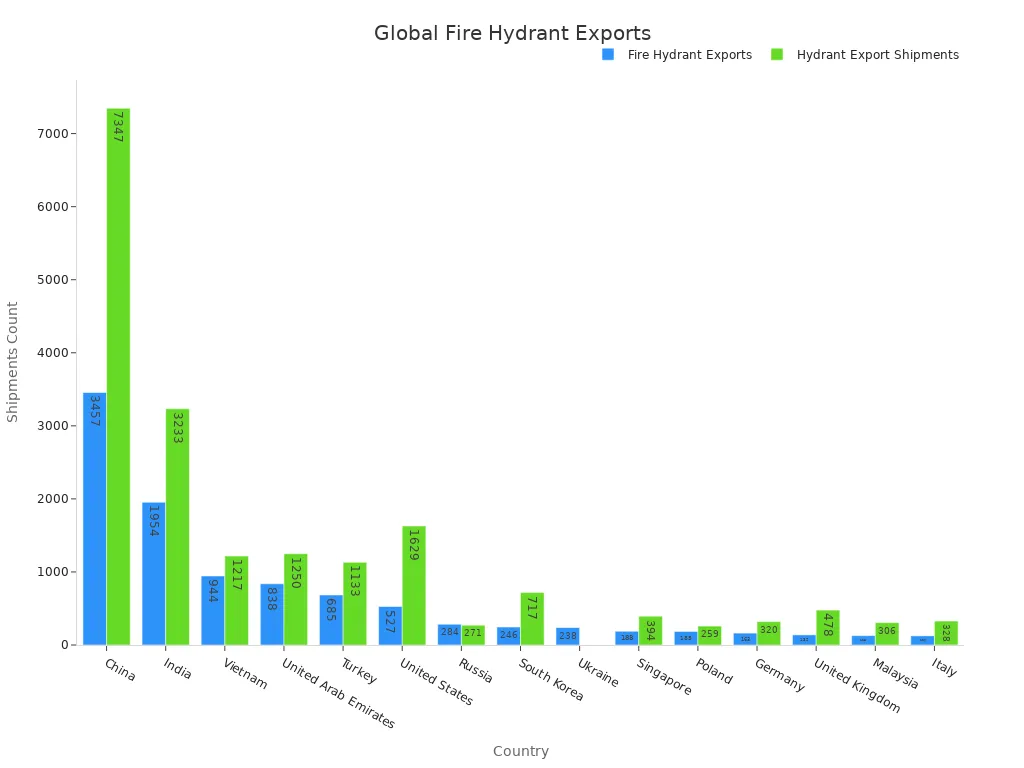
Italy maintains a presence in the global fire hydrant market, though its export volume remains modest compared to leading countries. The latest data shows Italy shipped 126 fire hydrant units and 328 units in the broader hydrant category. This places Italy behind major exporters such as China and India. The following table illustrates Italy’s position among other key players:
| Country | Fire Hydrant Export Shipments | Hydrant Export Shipments |
|---|---|---|
| China | 3,457 | 7,347 |
| India | 1,954 | 3,233 |
| United States | 527 | 1,629 |
| Germany | 163 | 320 |
| Italy | 126 | 328 |
Design and Technological Edge in Fire Hydrant Manufacturing
Italian manufacturers focus on combining tradition with innovation. They use advanced engineering to create hydrants that meet strict safety standards. Many companies invest in modern materials and smart features, such as corrosion-resistant coatings and leak detection sensors. This approach helps Italian products stand out in markets that value both reliability and design.
Strategic Trade Partnerships
Italy builds strong trade partnerships to support its fire hydrant industry. The country sources fire hose components from Turkey, India, and Malaysia. Turkey supplies 50% of Italy’s fire hose imports, while India provides 45%. These relationships help Italy maintain a steady supply chain and adapt to changing global trade conditions. Urbanization and infrastructure projects in Europe and beyond drive demand for Italian fire protection systems. By leveraging global trade data and innovation trends, Italy continues to expand its reach in the fire hydrant market.
Comparative Analysis of Top Fire Hydrant Exporters

Similarities in Fire Hydrant Export Strategies
Top exporters share several strategies that help them maintain a competitive edge. India and China focus on emerging and fast-growing markets, aiming to avoid saturated regions. They use detailed price analysis and market growth data to identify the most profitable opportunities. Exporters from these countries also leverage Free Trade Agreements (FTAs) to reduce import duties, making their products more attractive to buyers. Many companies choose to source materials from nearby countries, which helps lower freight costs and speeds up delivery. China, India, and Vietnam emphasize cost-effectiveness by offering economical pricing and ensuring reliable, high-volume shipments. These approaches allow them to adapt quickly to changing global demands and maintain strong positions in the market.
Differences in Market Focus and Growth Drivers
Exporters from different regions target unique markets and rely on distinct growth drivers.
- Asia-Pacific countries, such as China and India, experience rapid growth due to urbanization and large investments in commercial and industrial construction. For example, China’s government invested $394 billion in new buildings.
- North America, led by the United States, focuses on mature urban centers and advanced safety standards. Growth comes from strict fire safety regulations and ongoing infrastructure development.
- Europe emphasizes sustainability and innovation, with companies developing eco-friendly and technologically advanced hydrant solutions.
- Other regions, including South America and the Middle East, show steady growth as infrastructure investments and fire safety measures increase.
| Region | Market Focus | Growth Drivers |
|---|---|---|
| North America | Mature urban centers | Strict regulations, infrastructure development |
| Europe | Sustainability and innovation | Eco-friendly solutions, advanced technology |
| Asia-Pacific | Rapid urban and industrial growth | Urbanization, construction investment, government spending |
| Others | Emerging infrastructure markets | New investments, rising fire safety awareness |
Future Outlook for Fire Hydrant Exports
Predicted Fire Hydrant Export Trends for 2026 and Beyond
Industry experts expect the global market to expand at a steady pace through 2033. The market size will likely reach $2.8 billion by 2033, up from $1.5 billion in 2024. Growth will accelerate, with a projected compound annual growth rate (CAGR) of 7.4% between 2026 and 2033. Asia-Pacific will drive more than 35% of total revenue growth, fueled by urban development and infrastructure projects. Companies will focus on new technologies, such as artificial intelligence and machine learning, to improve predictive maintenance and operational efficiency. The market will remain diverse, with products like wet barrel, dry barrel, and freezeless hydrants. Manufacturers will use materials such as cast iron, brass, stainless steel, and composites to meet different needs. The table below summarizes these projections:
| Metric/Aspect | Details/Projection |
|---|---|
| Forecasted CAGR (2026-2033) | 7.4% |
| Market Size 2024 | USD 1.5 billion |
| Market Size 2033 | USD 2.8 billion |
| Key Growth Region | Asia-Pacific (over 35% of total revenue growth) |
| Technological Drivers | AI, machine learning, data analytics |
| Market Segmentation | Wet Barrel, Dry Barrel, PIV, Freezeless, FDC; Cast Iron, Brass, Stainless Steel, Plastic, Composite; Urban, Rural, Industrial, Residential, Commercial; Municipal, Construction, Manufacturing, Hospitality, Education |
| Strategic Factors | Collaborations, regional growth, sustainability |
Opportunities and Challenges in the Fire Hydrant Market
Manufacturers will find many opportunities in emerging markets and smart city projects. New partnerships and regional collaborations will help companies reach more customers. Sustainability trends will encourage the use of eco-friendly materials and energy-saving designs. However, the industry will face challenges. Supply chain disruptions may cause delays. Companies must also keep up with changing safety standards and regulations. Competition will increase as more players enter the market. To succeed, companies must invest in research, adapt quickly, and maintain high product quality.
- China, the United States, Germany, India, and Italy lead global fire hydrant exports in 2025.
- Their success comes from strong manufacturing, advanced technology, and effective trade policies.
- Urbanization and infrastructure projects support market growth.
Industry stakeholders should monitor fire hydrant export trends for future opportunities.
FAQ
What factors drive fire hydrant export growth in 2025?
Urbanization, stricter fire safety regulations, and new infrastructure projects increase demand. Manufacturers invest in smart technology and durable materials to meet global standards.
Which fire hydrant types see the highest export demand?
Dry barrel and conventional hydrants lead exports. These types offer reliability in various climates and meet the needs of industrial and municipal buyers.
How do exporters ensure fire hydrant quality?
Exporters follow international standards, use advanced testing, and partner with certified labs. Regular inspections and compliance checks guarantee product safety and performance.
Post time: Jul-01-2025